D3.js Open source · ISC
The JavaScript library for bespoke data visualization
Introduction
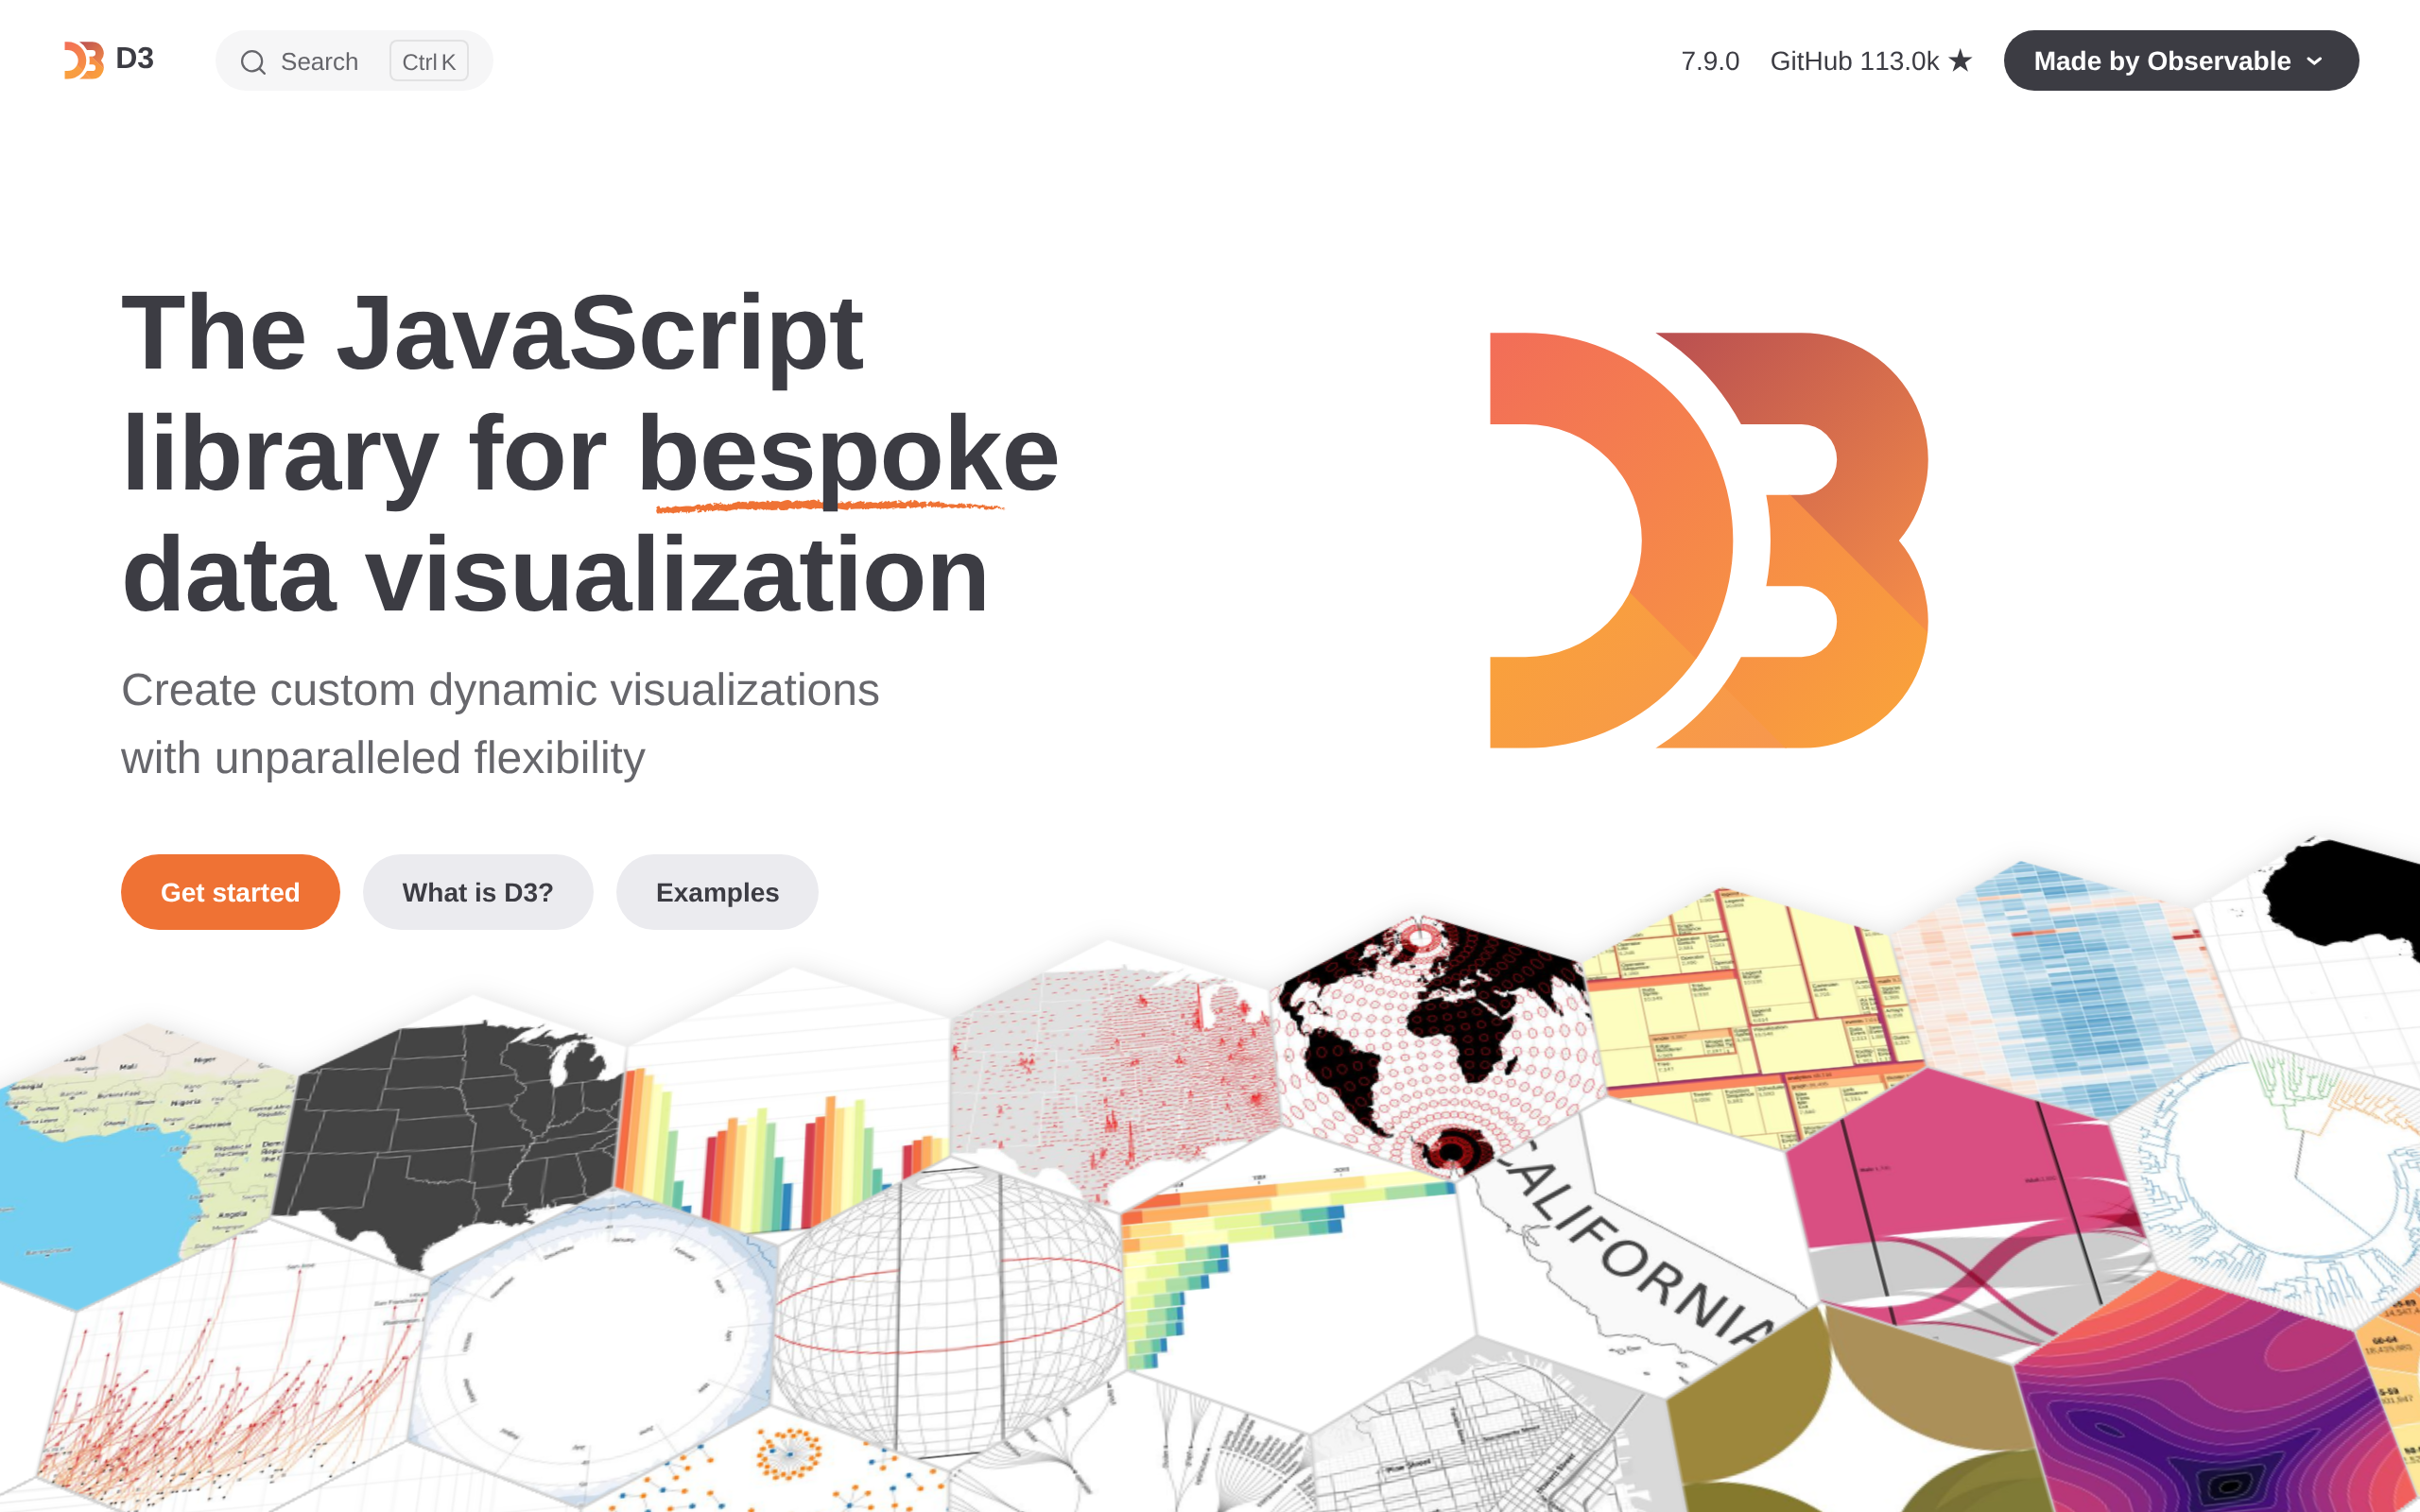
D3 is the JavaScript library for bespoke data visualization. Create custom dynamic visualizations with unparalleled flexibility.
D3 is developed by Observable, the platform for collaborative data analysis. The D3 team also builds Observable Plot, a high-level API for quick charts built on top of D3.
- **Selections and transitions:** Create, update, and animate the DOM based on data without the overhead of a virtual DOM.
- **Scales and axes:** Encode abstract data into visual values such as position, size, and color. Explain position encodings with axes.
- **Shapes:** Render arcs, areas, curves, lines, links, pies, stacks, symbols… and any geometric primitive you might need to visualize data.
- **Interactions:** Facilitate exploration with reusable interactive behaviors, including panning, zooming, brushing, and dragging.
- **Layouts:** Treemaps, trees, force-directed graphs, Voronoi, contours, chords, circle-packing… a library of layout algorithms at the ready.
- **Geographic maps:** More spherical projections than you can shake a stick at, with arbitrary aspects, adaptive sampling, and flexible clipping.
- **… and much more:** CSV parsing, localized date parsing and formatting, color spaces, calendar math, statistics, and can I stop listing features now?
Data visualizationJavaScript libraryDOM transitionsScales and axesInteractive chartsLayout algorithmsGeographic mapsObservable Plot
Screenshots
Deployment
Observable
适用于在官方 Observable 平台上无需安装即可构建、共享并协作发布 D3 可视化与数据应用。
In solutions
前端框架 · 10 candidates →Ad slot 300 × 250 Ad
About the data
Stars / commit times sync automatically from the GitHub API; pricing and features are human-verified.