DataMaps Open source · MIT
Customizable SVG map visualizations for the web in a single Javascript file using D3.js
Introduction
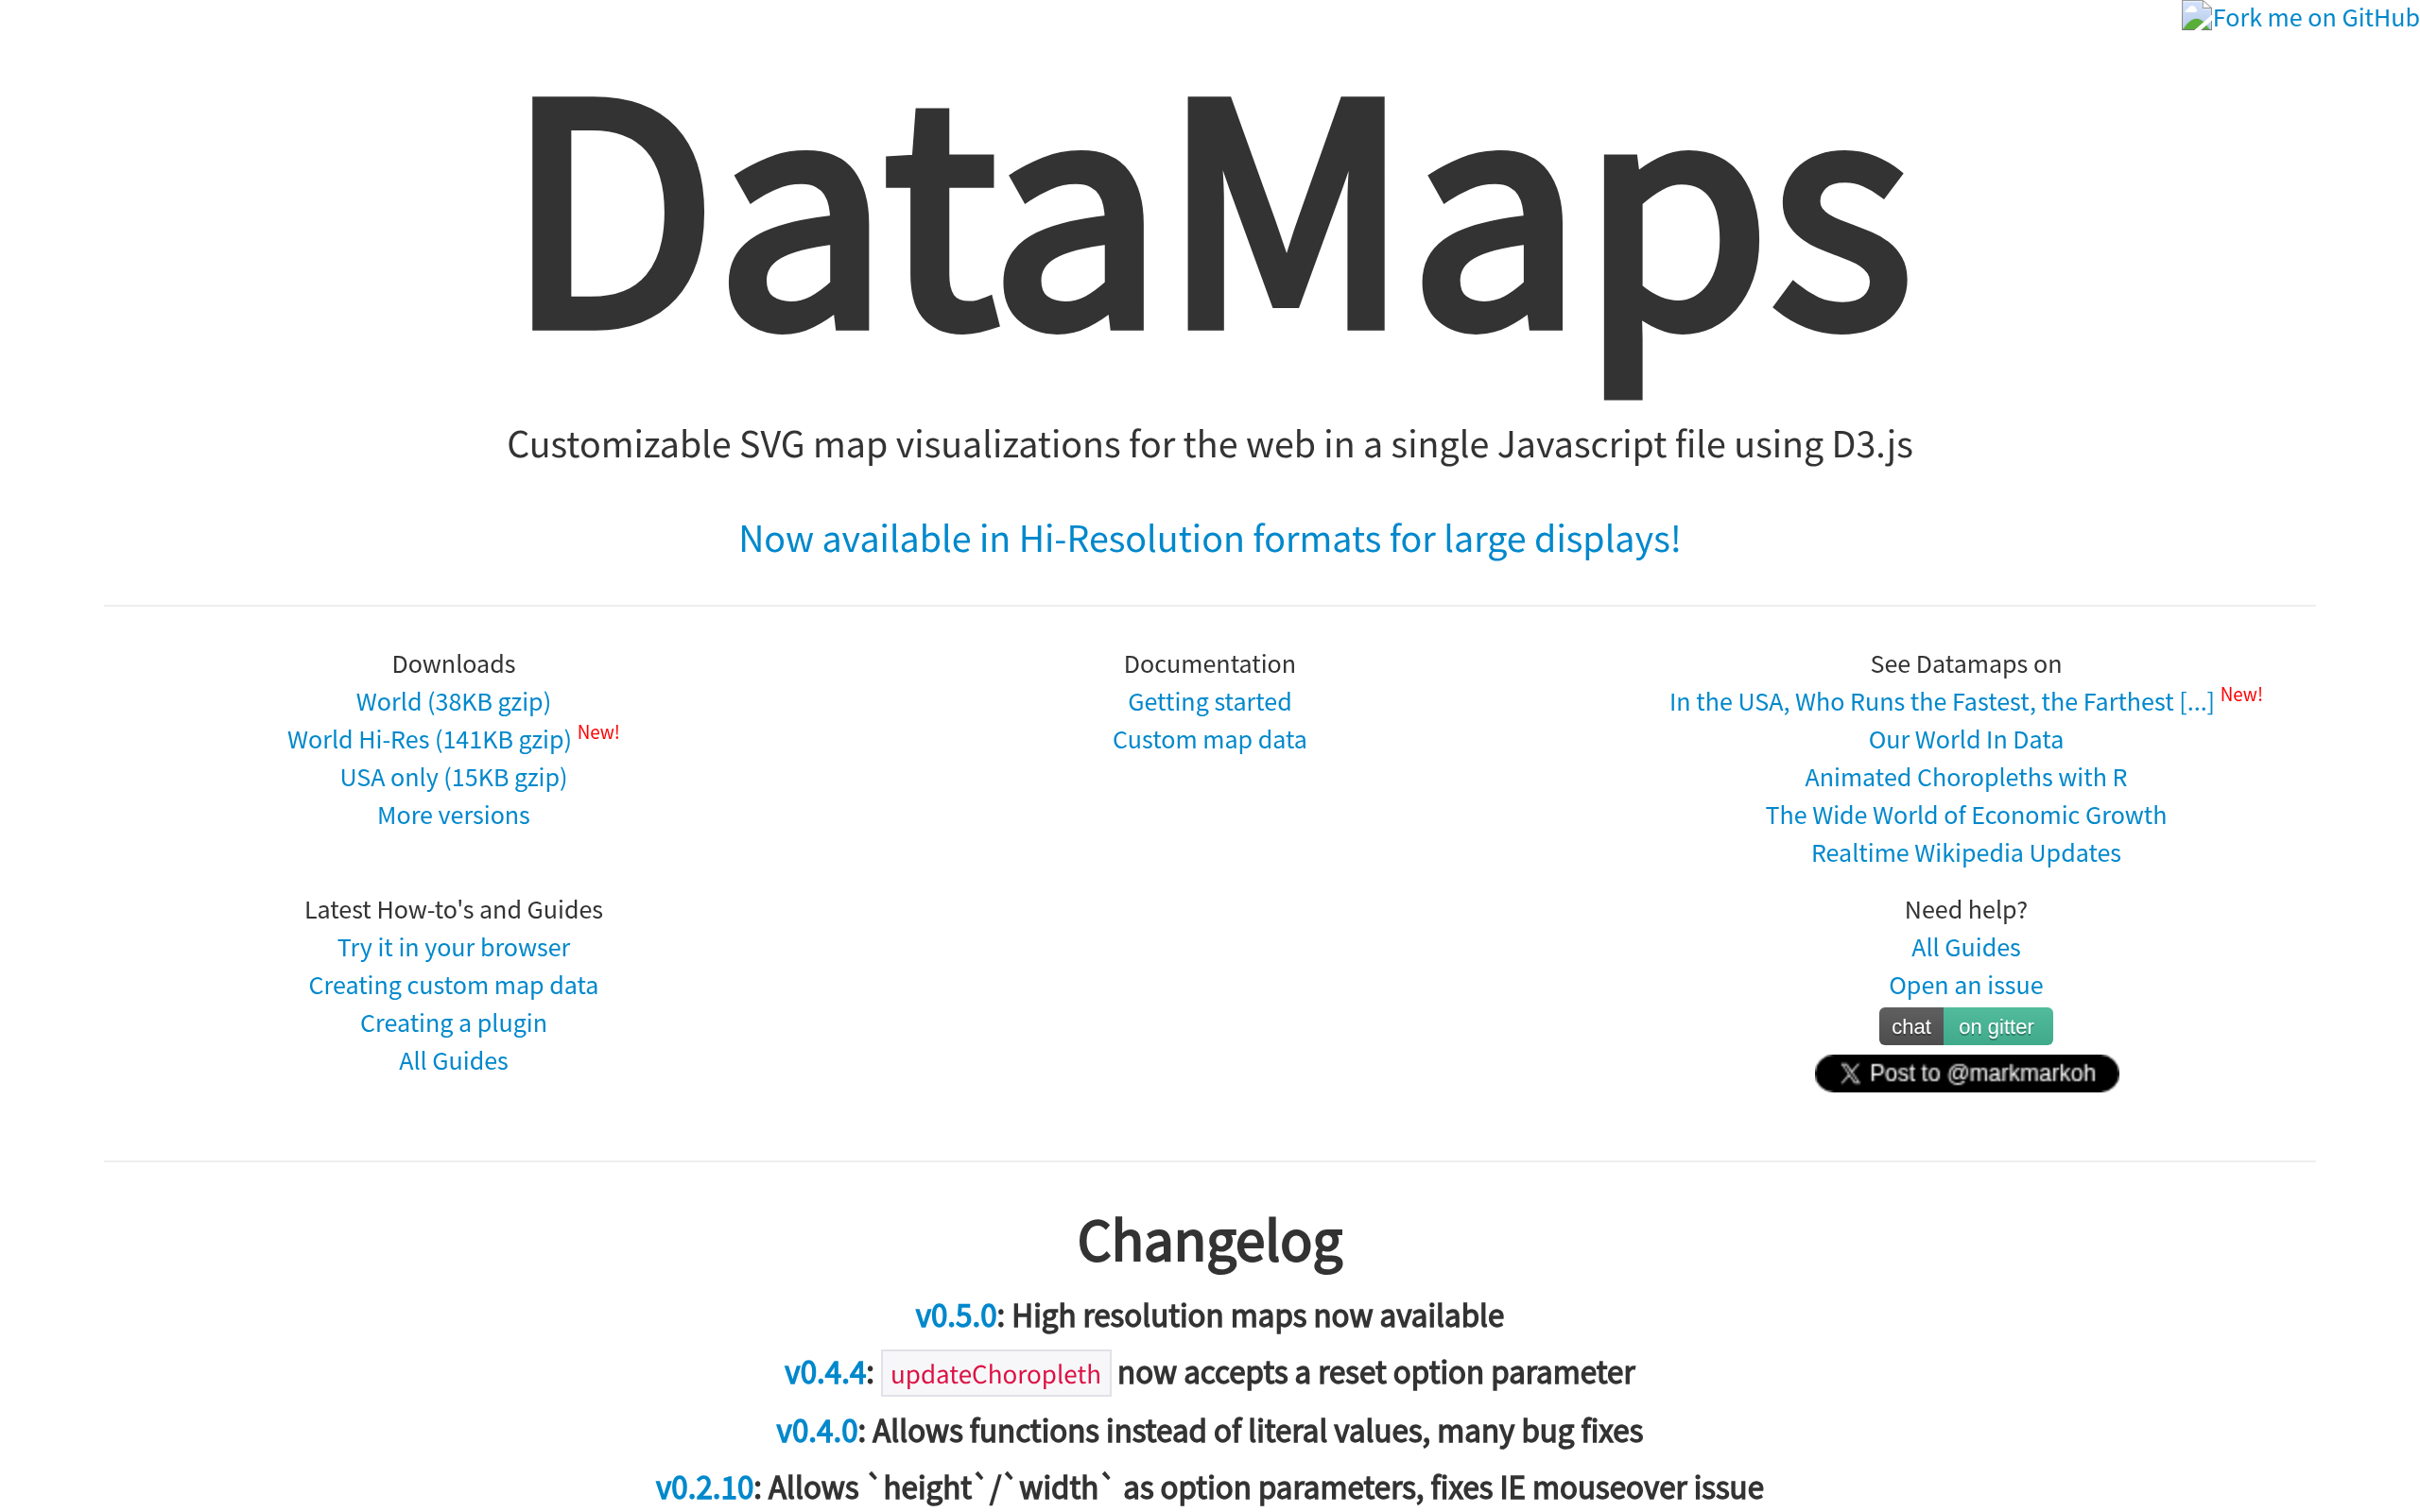
DataMaps provides **customizable SVG map visualizations for the web in a single Javascript file using D3.js**. Now available in Hi-Resolution formats for large displays.
Downloads include **World (38KB gzip)**, **World Hi-Res (141KB gzip)**, and **USA only (15KB gzip)**. Examples include Basic, Choropleth, State Labels, Bubbles, Arcs, Projections & Graticules, and Zoom.
Configuration options include `scope` — currently supports `usa` and `world`, however with custom map data you can specify your own — plus `projection`, `responsive`, `dataUrl`, `geographyConfig`, `bubblesConfig`, and `arcConfig`. Plugins shown in the examples include the bubble plugin, arcs plugin, graticule plugin, and state labels plugin.
A project by Mark DiMarco. Released under the MIT License.
SVG mapsD3.jsChoropleth mapsBubble mapsArc mapsCustom map dataTopoJSONMIT License
Screenshots
Deployment
静态 JavaScript 文件引入(下载版)
适用于在网页或静态站点中直接加载官方提供的 DataMaps 单文件及 D3.js,按需选择 World、World Hi-Res 或 USA-only 版本渲染 SVG 地图。
浏览器在线试用
适用于在正式集成前通过官方提供的浏览器示例快速验证配置、投影、气泡、弧线等可视化效果。
Details
Type Open-source software
License MIT
Last verified 2026-07-18
Ad slot 300 × 250 Ad
About the data
Stars / commit times sync automatically from the GitHub API; pricing and features are human-verified.