Flourish Proprietary
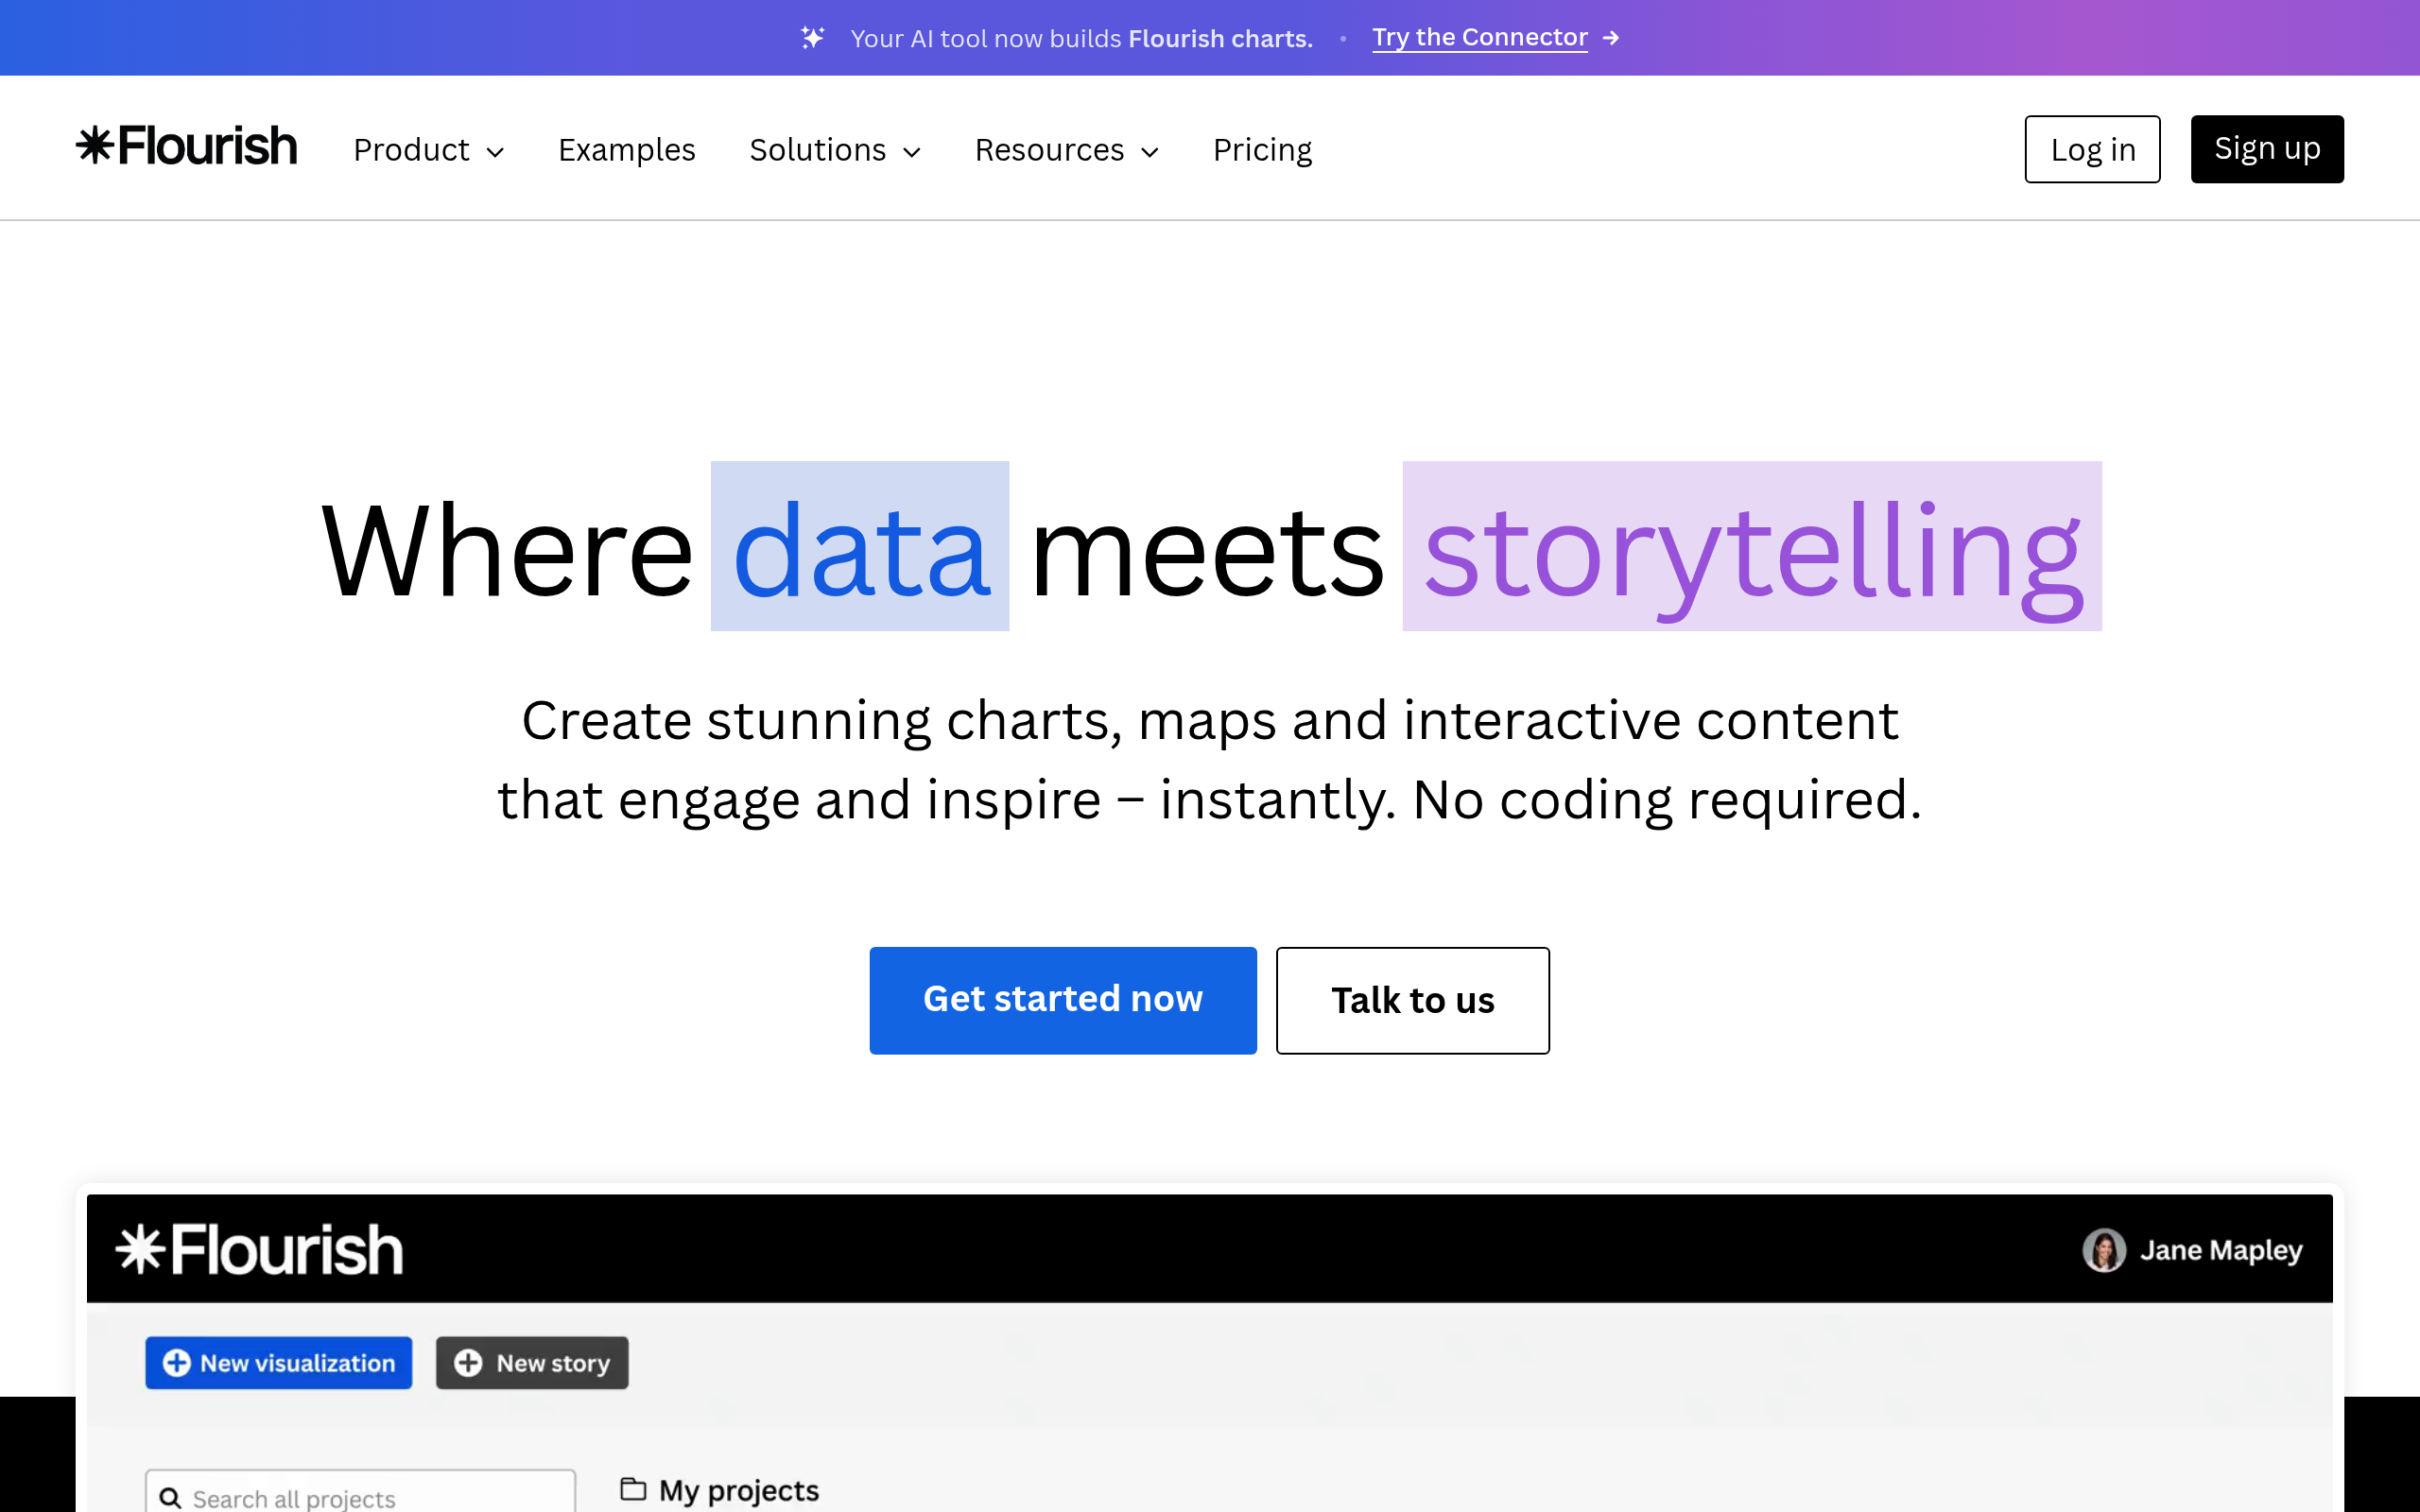
Create stunning charts, maps and interactive content that engage and inspire – instantly. No coding required.
Introduction
**Flourish** is a powerful data visualization platform that empowers the world to tell stories with data.
Create interactive charts and maps using no-code templates. Build multi-step explainers with charts and captions. Visualize text, images and audio with interactive templates.
From data visualizations and interactive elements to immersive storytelling, Flourish empowers you to turn complex data into interactive visuals that wow your audience - whether you're an expert or just starting out.
- **Your data, fully interactive:** Transform raw data into interactive visualizations that are as sleek as they are engaging.
- **No-code creation, stunning results:** Create professional-grade visuals in minutes — no coding, no hassle. Simply import your data and transform it into interactive visuals that grab attention.
- **Share anywhere, look great everywhere:** Seamlessly share and embed your visualisations across platforms—websites, presentations, social media assets and more.
- **Team up, stay on brand:** Simplify collaboration and ensure your visuals stay polished and on-brand.
Flourish is not typically regarded as a business intelligence tool. While its templates and API allow for data exploration and dashboard integration, its primary focus is on data storytelling, especially for presentations and digital publications.
Flourish sets itself apart through ease of use, storytelling, flexibility and publishability. No specific technical skills are needed thanks to its template-based system and intuitive user interface. The Flourish SDK lets developers create custom templates without limitations on functionality or design.
Flourish was co-founded in 2018 by Duncan Clark and Robin Houston. In 2022, Canva acquired Flourish with the shared goal of democratizing data storytelling and making data visualization accessible to all.
Data visualizationInteractive chartsInteractive mapsNo-code templatesData storytellingScrollytellingEmbeddingCustom templates
Screenshots
Deployment
Flourish 云端发布与嵌入
适合在 Flourish 托管项目并将交互式图表嵌入网站或在线内容,免费版可公开发布但带 attribution。
Canva 嵌入
适合 Canva Business/Enterprise 用户在 Canva 设计中直接插入和展示交互式 Flourish 图表。
PowerPoint 嵌入
适合制作演示文稿的个人或团队,将交互式 Flourish 图表用于 PowerPoint 汇报。
HTML 导出自托管
适合 Publisher 及以上用户下载 HTML 文件自行托管,以获得完整发布控制。
Flourish alternatives
Apache ECharts Open source
Apache ECharts is a powerful, interactive charting and data visualization library for browser
Leaflet Open source
Leaflet is a modern, lightweight open-source JavaScript library for mobile-friendly interactive maps.
ShowDoc Open source
一个非常适合IT团队的在线API文档、技术文档工具。你可以使用Showdoc来编写在线API文档、技术文档、数据字典、在线手册
集简云 Proprietary
集简云帮助中心文档 | 如何无需API代码开发完成系统集成
Todoist Proprietary
Banani Proprietary
Mapkick Open source
Mapkick - Create beautiful JavaScript maps with one line of Ruby
deegree Open source
Details
Type Commercial software
License freemium
Last verified 2026-07-18
Ad slot 300 × 250 Ad
About the data
Stars / commit times sync automatically from the GitHub API; pricing and features are human-verified.