Frappe Charts Heatmap Open source · MIT
The heatmap is a representation of day-wise data (similar to the GitHub Contribution Graph).
Introduction
Heatmap is for **Day-based Month-wise data**.
> The heatmap is a representation of day-wise data (similar to the GitHub Contribution Graph). It spaces out data values linearly, across 5 levels (zero data kept exclusive).
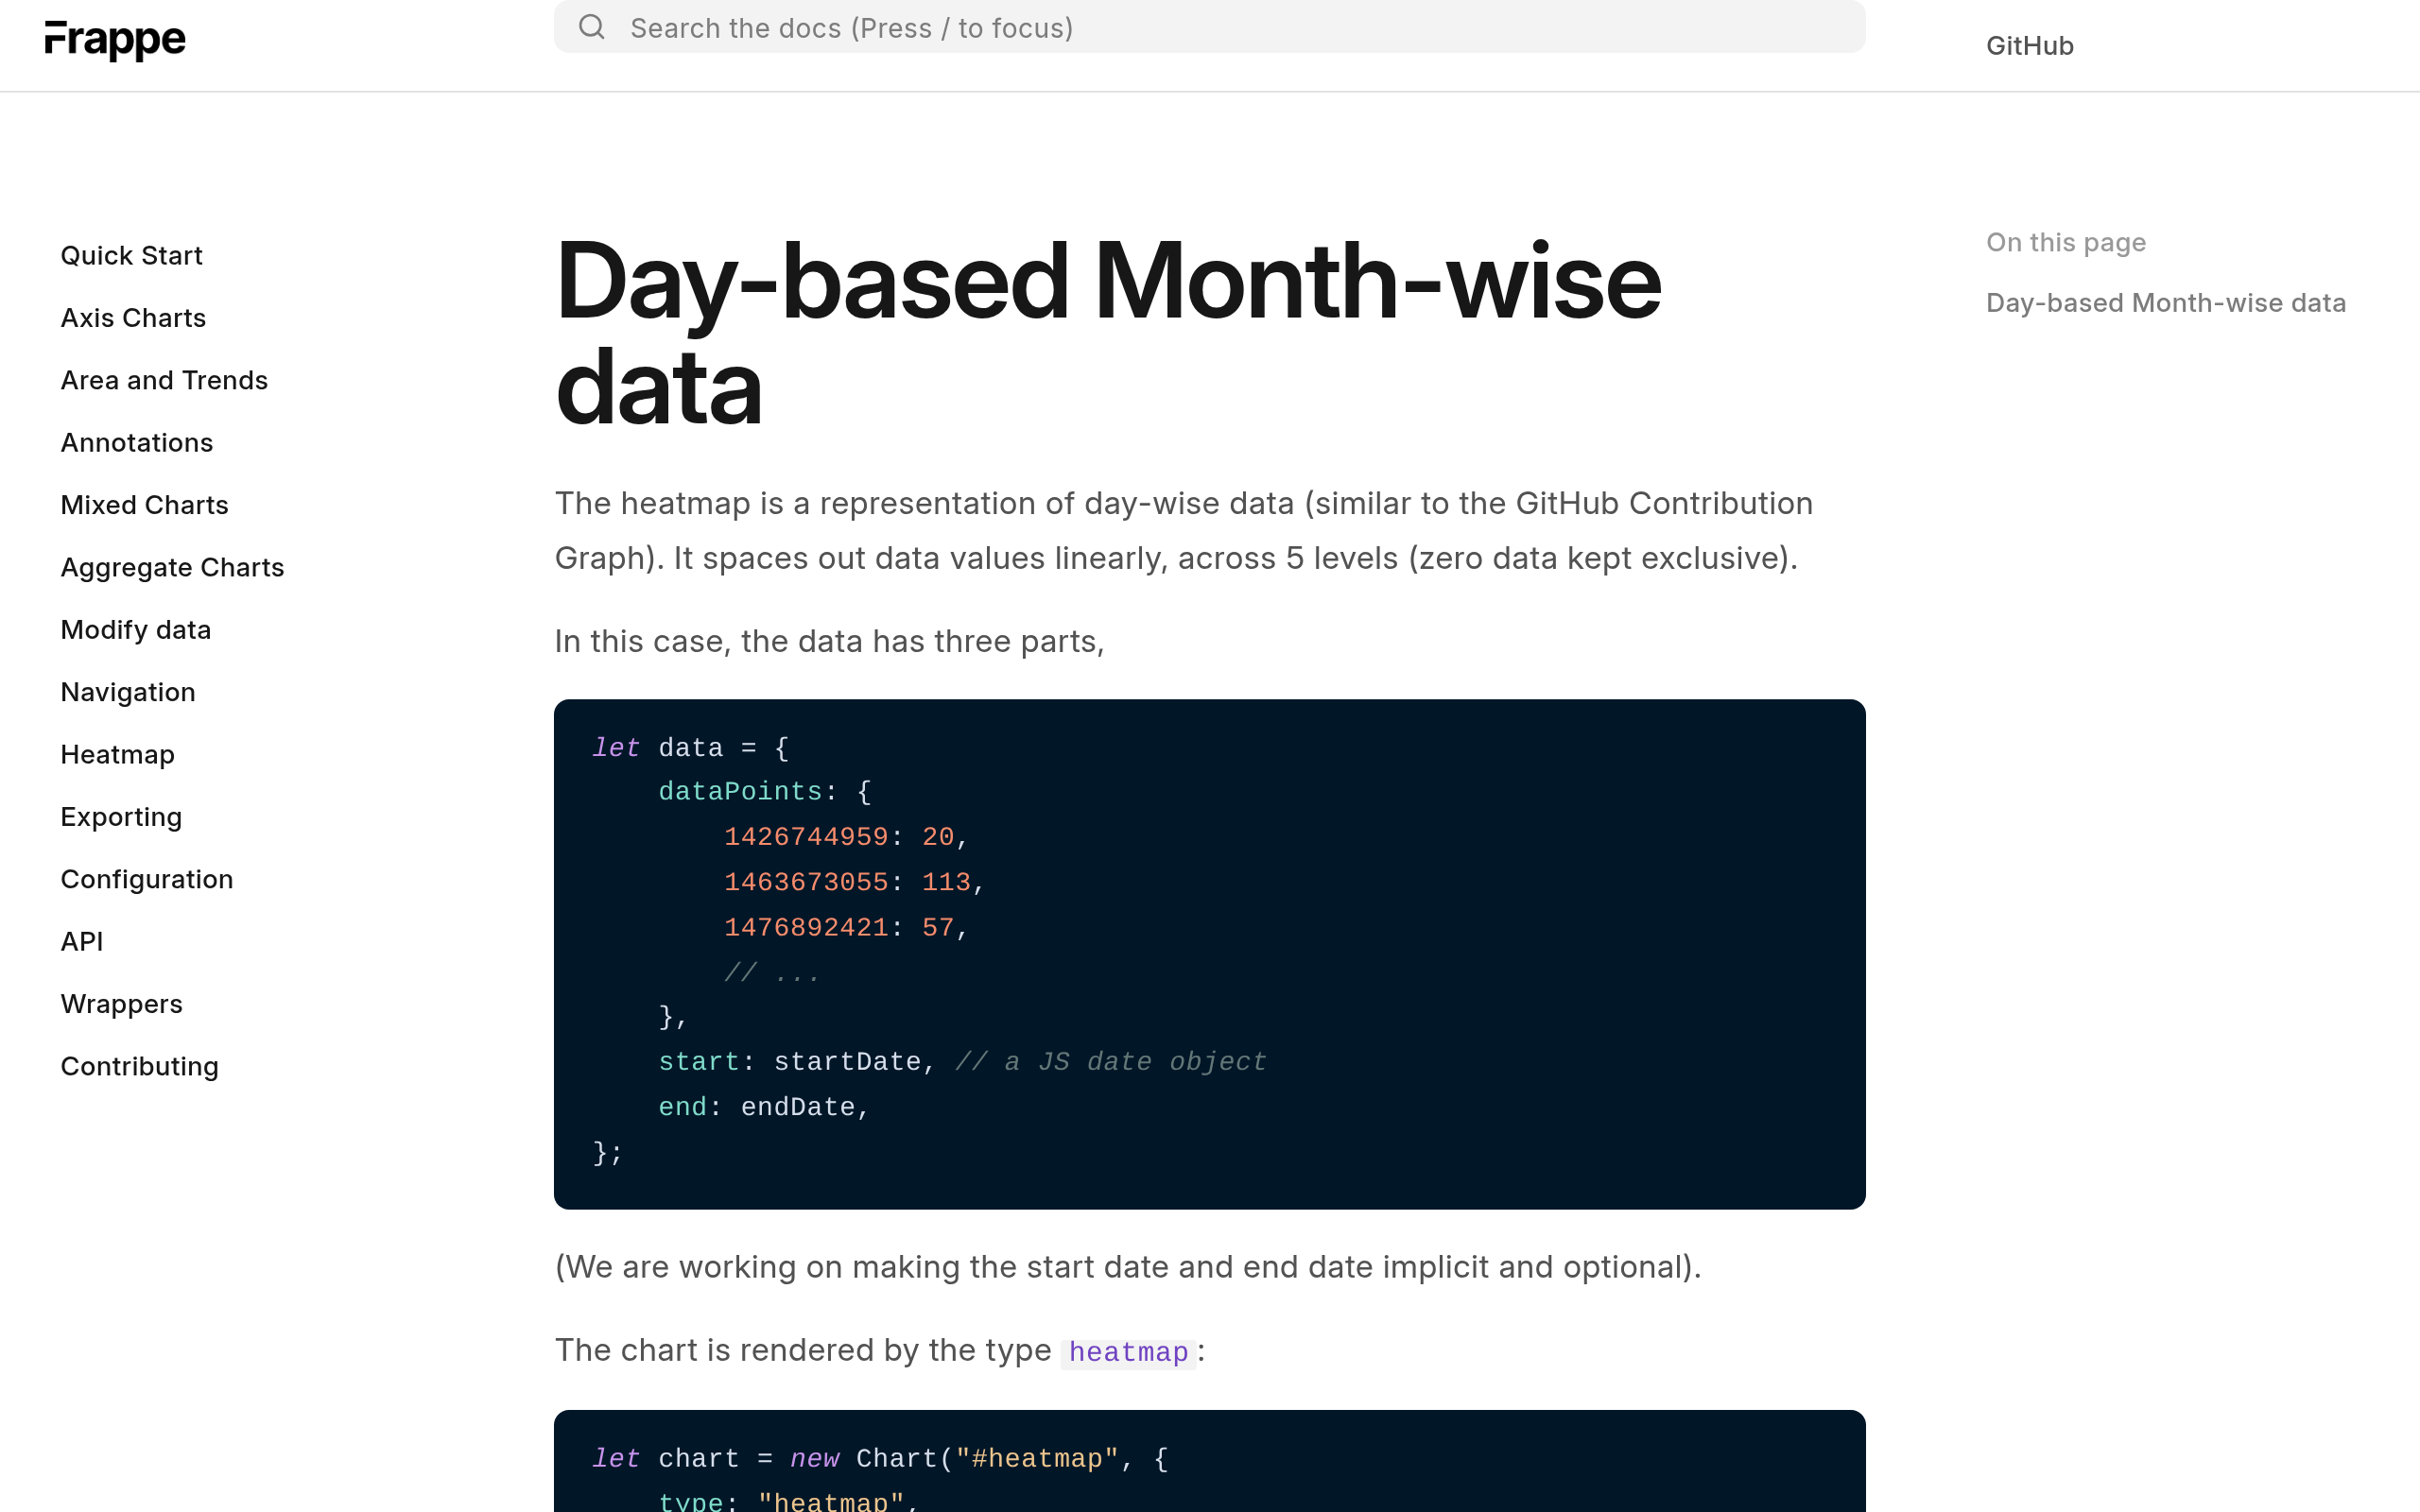
In this case, the data has three parts: `dataPoints`, `start`, and `end`.
```js
let data = {
dataPoints: {
1426744959: 20,
1463673055: 113,
1476892421: 57,
// ...
},
start: startDate, // a JS date object
end: endDate,
};
```
The chart is rendered by the type `heatmap`:
```js
let chart = new Chart("#heatmap", {
type: "heatmap",
data: data,
});
```
If you wish you can configure the radius of heat squares:
```js
radius: 2, // default 0
```
Setting `discreteDomains` to `0` allows for a continous distribution of heat squares (as on GitHub), rather than showing the month-wise separation. A different set of colors can also be specified.
```js
discreteDomains: 0, // default 1
colors: ['#ebedf0', '#c0ddf9', '#73b3f3', '#3886e1', '#17459e'],
```
The documentation navigation also lists Exporting, Configuration, API, Wrappers, and Contributing.
Heatmap chartsDay-wise dataMonth-wise dataGitHub-style graphJavaScript chartsCustom colorsChart API
Screenshots
Deployment
GitHub 源码
适合从官方 GitHub 仓库获取 Frappe Charts 并按文档在前端项目中集成 Heatmap 图表。
Details
Type Open-source software
License MIT
Last verified 2026-07-18
Ad slot 300 × 250 Ad
About the data
Stars / commit times sync automatically from the GitHub API; pricing and features are human-verified.